
We make charts.
Not just any charts. Charts to educate, charts to inform, charts to entertain. Charts to communicate.
Add Two Studio is an information design agency that specialises in visual storytelling with data. We work with anyone who has a data story in any medium, and we also teach, running training courses in data visualisation.
So if you have an important story about some interesting information and need to know how to tell it, we’re the people to ask.
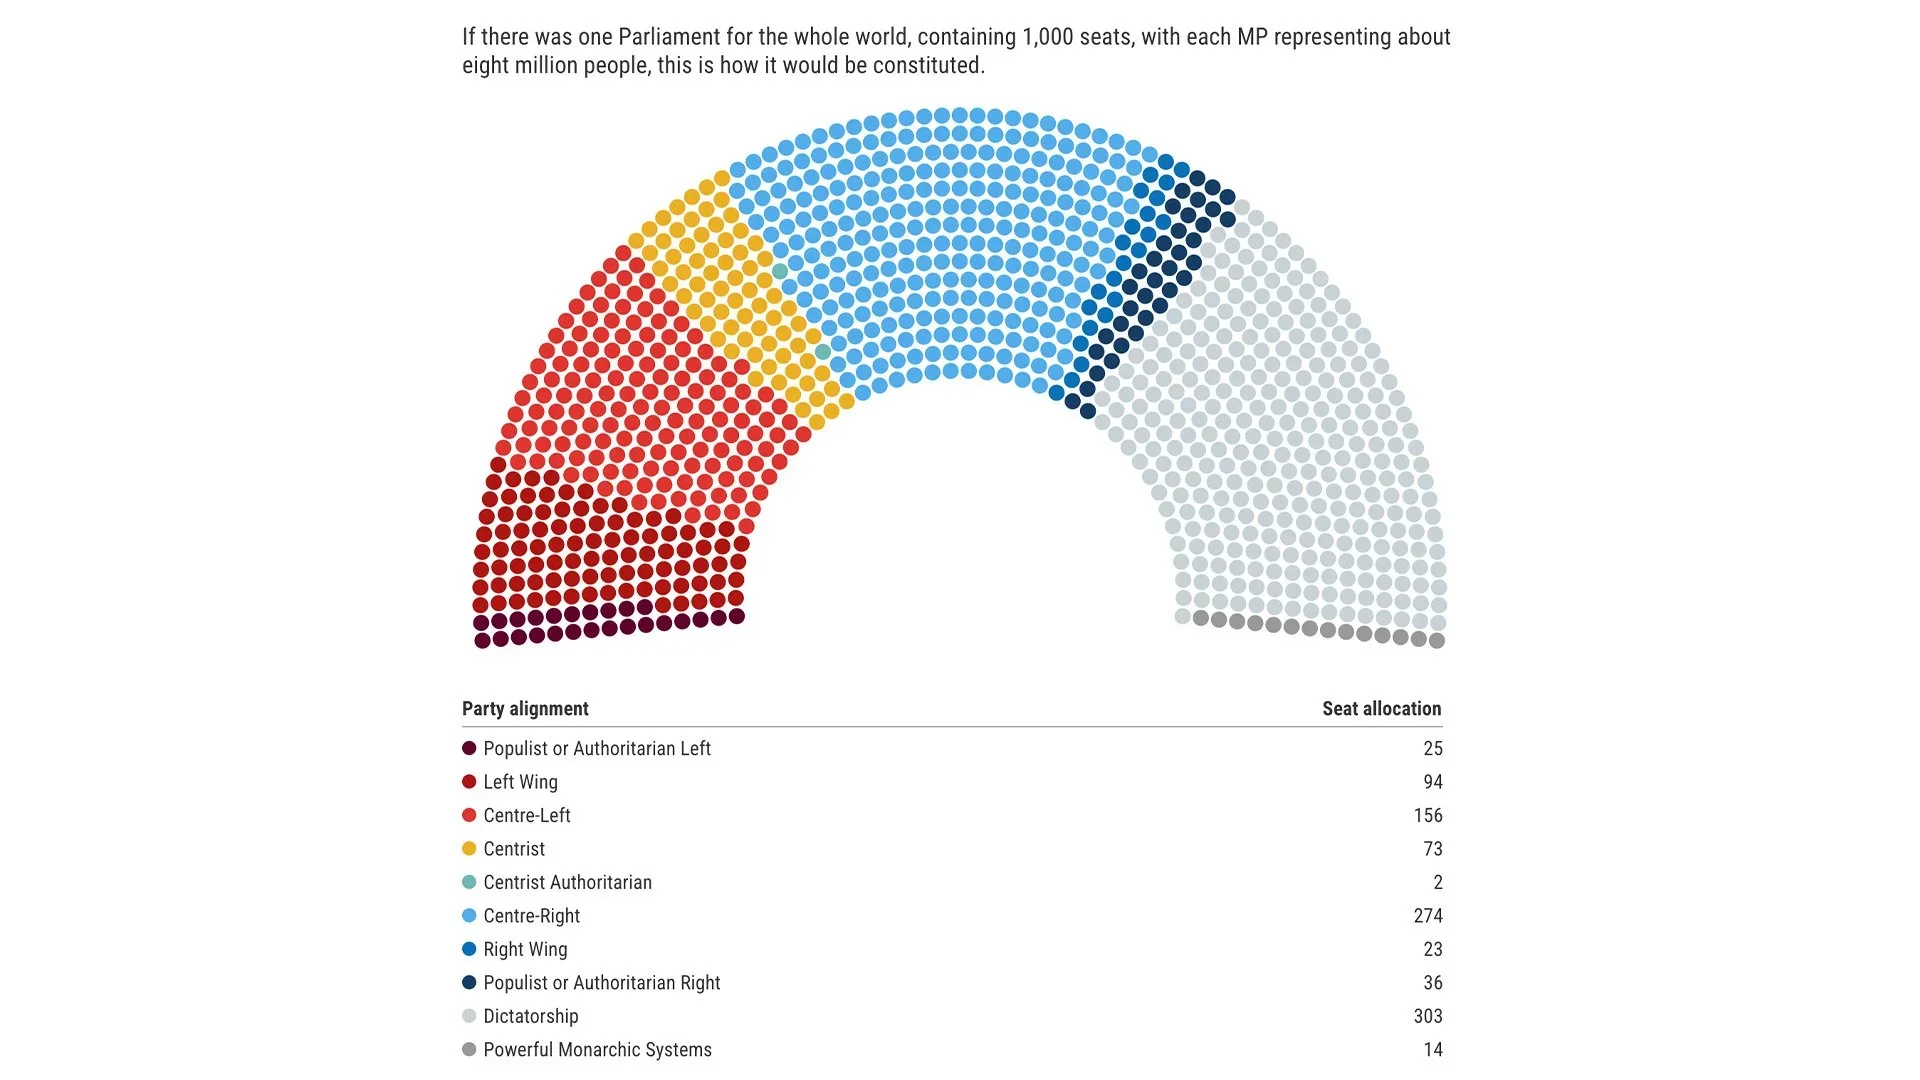
Global Parliament Index
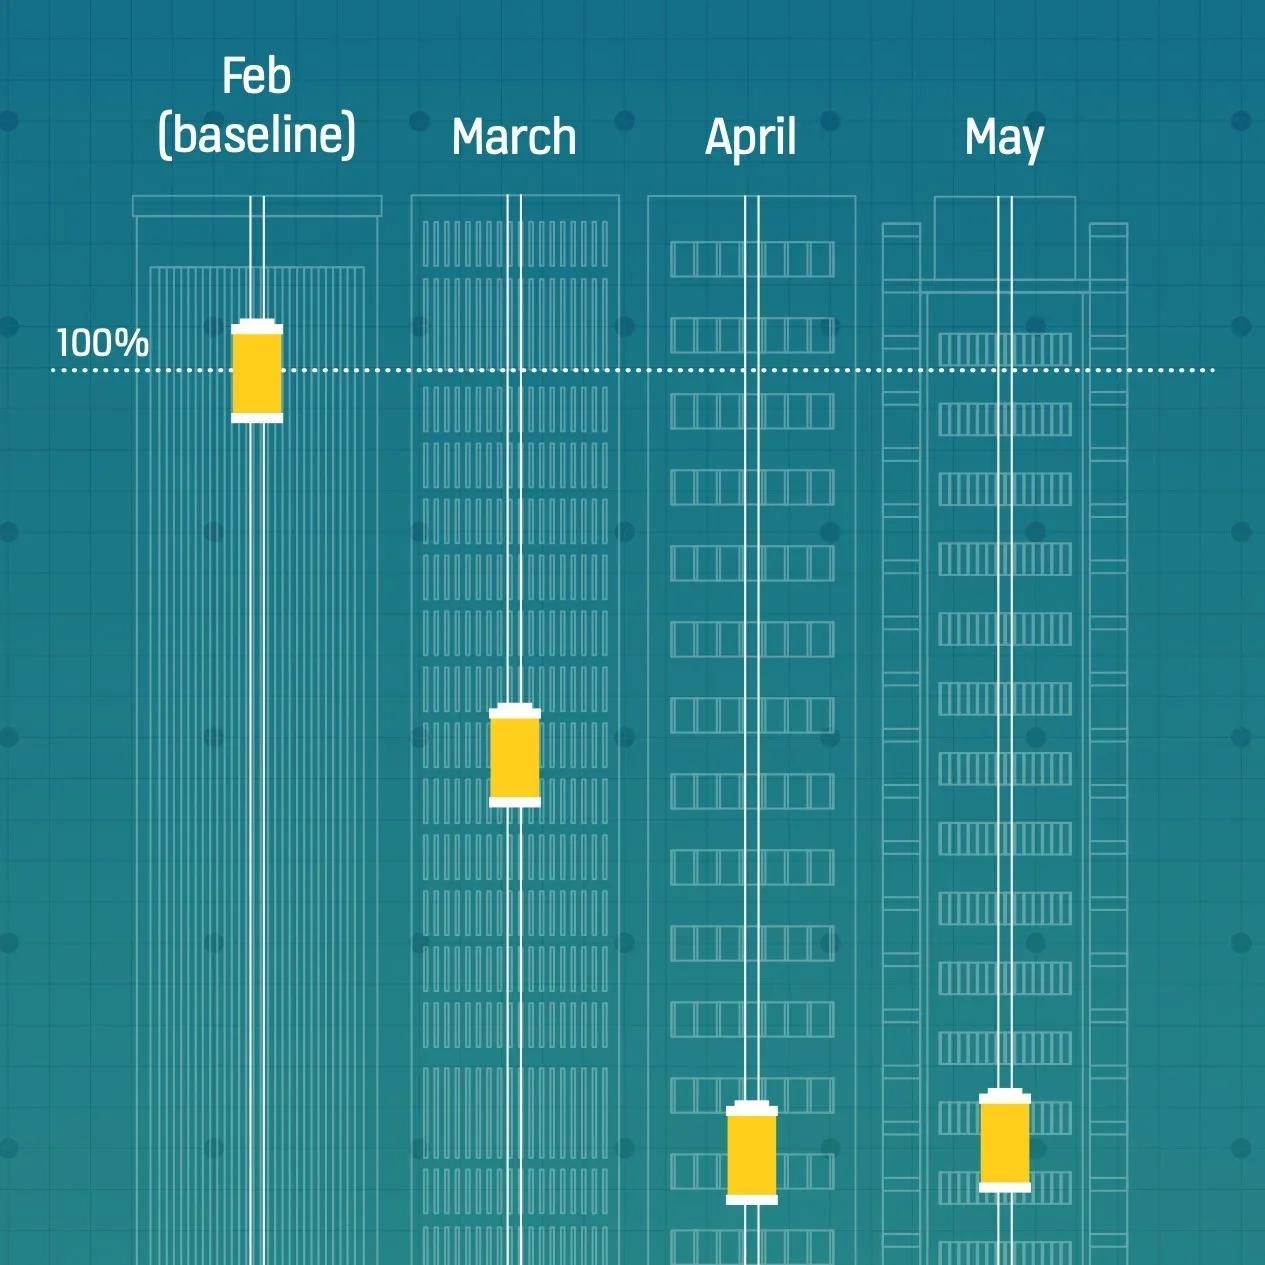
Next Level Cities

Pantheons
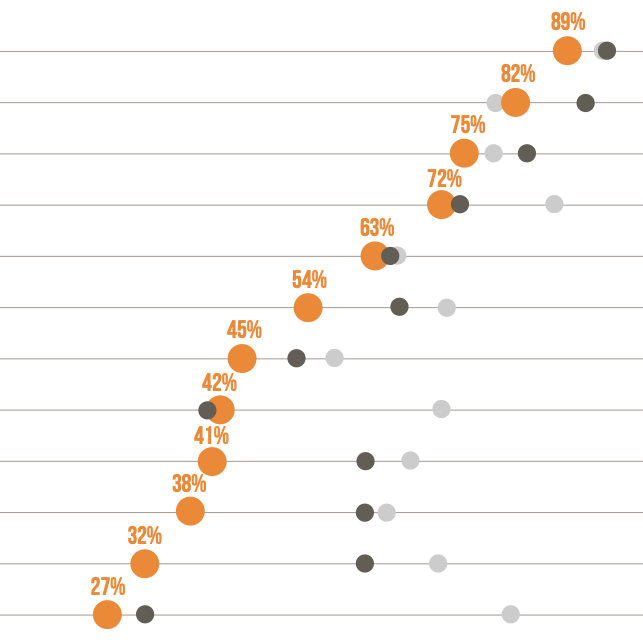
COVID & Journalism
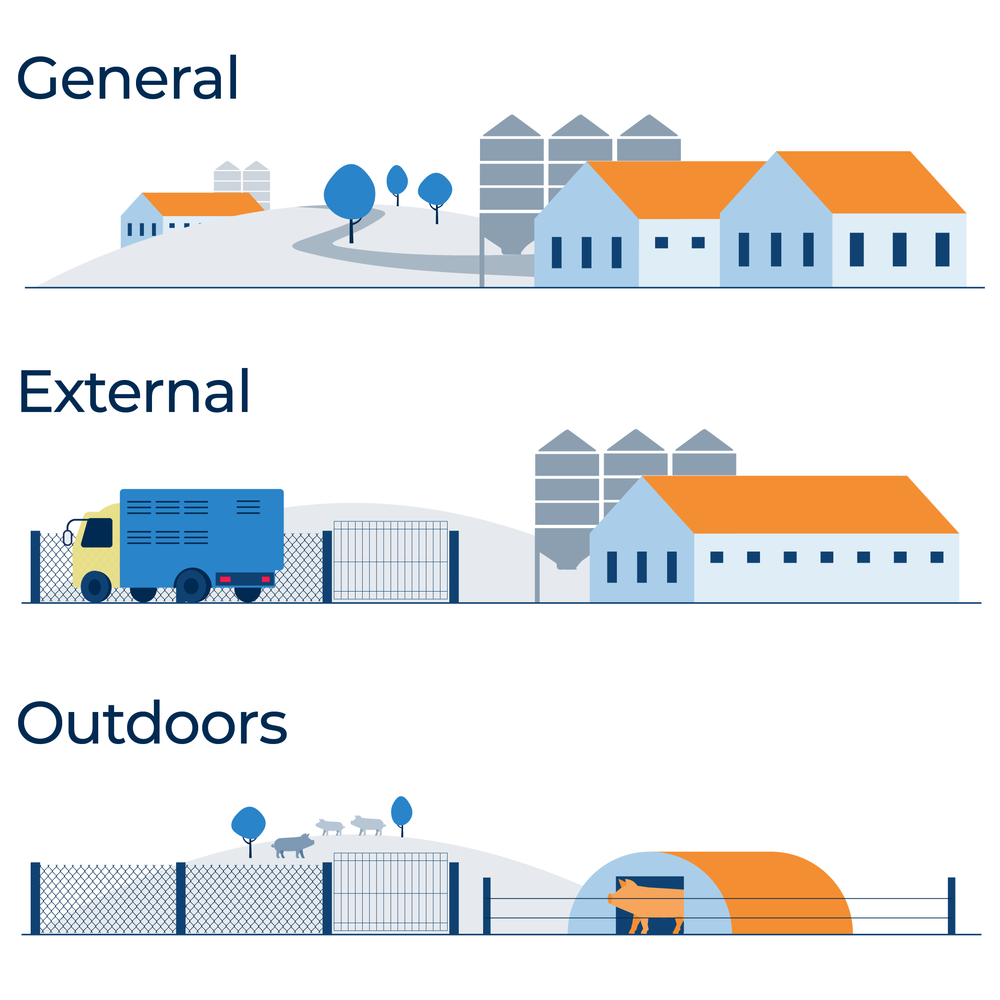
COMBAT
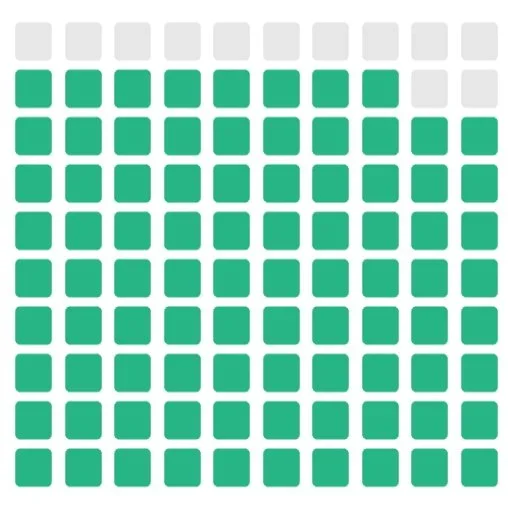
Transport Focus
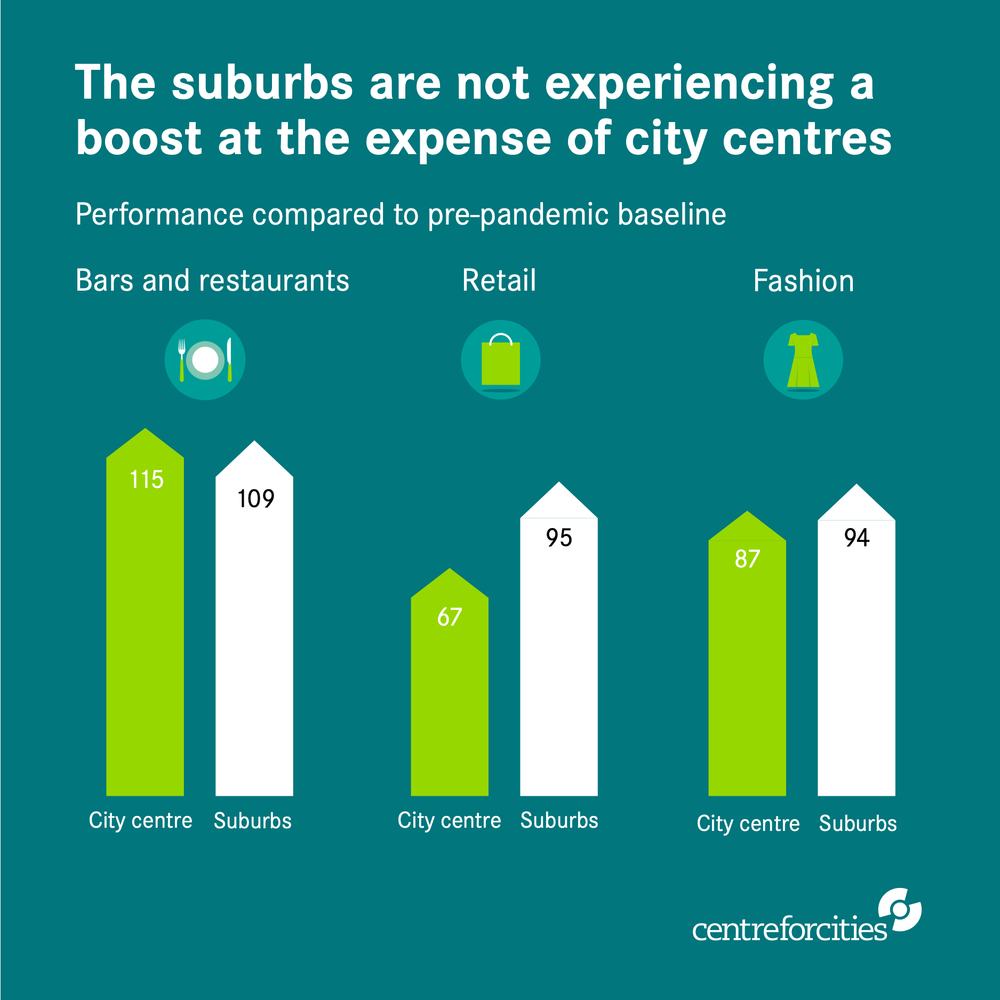
Cities Outlook 2022
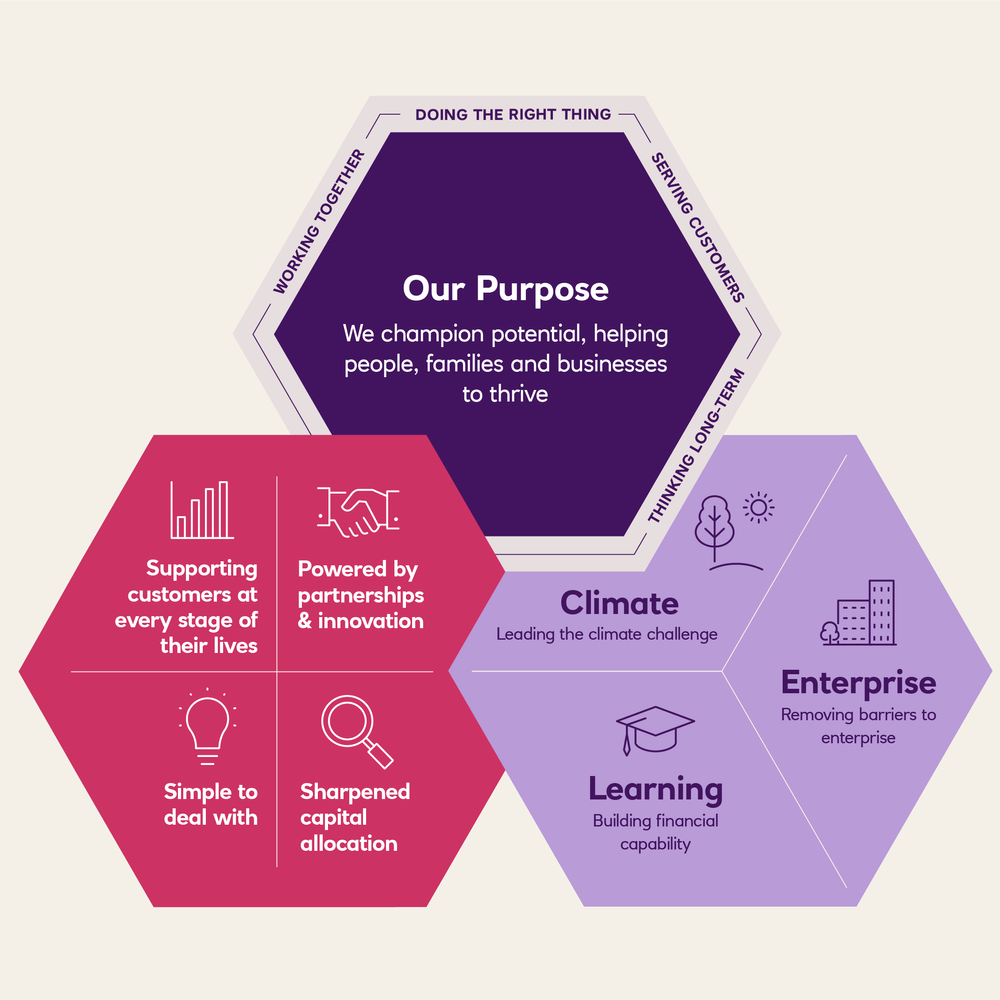
NatWest Group Strategy
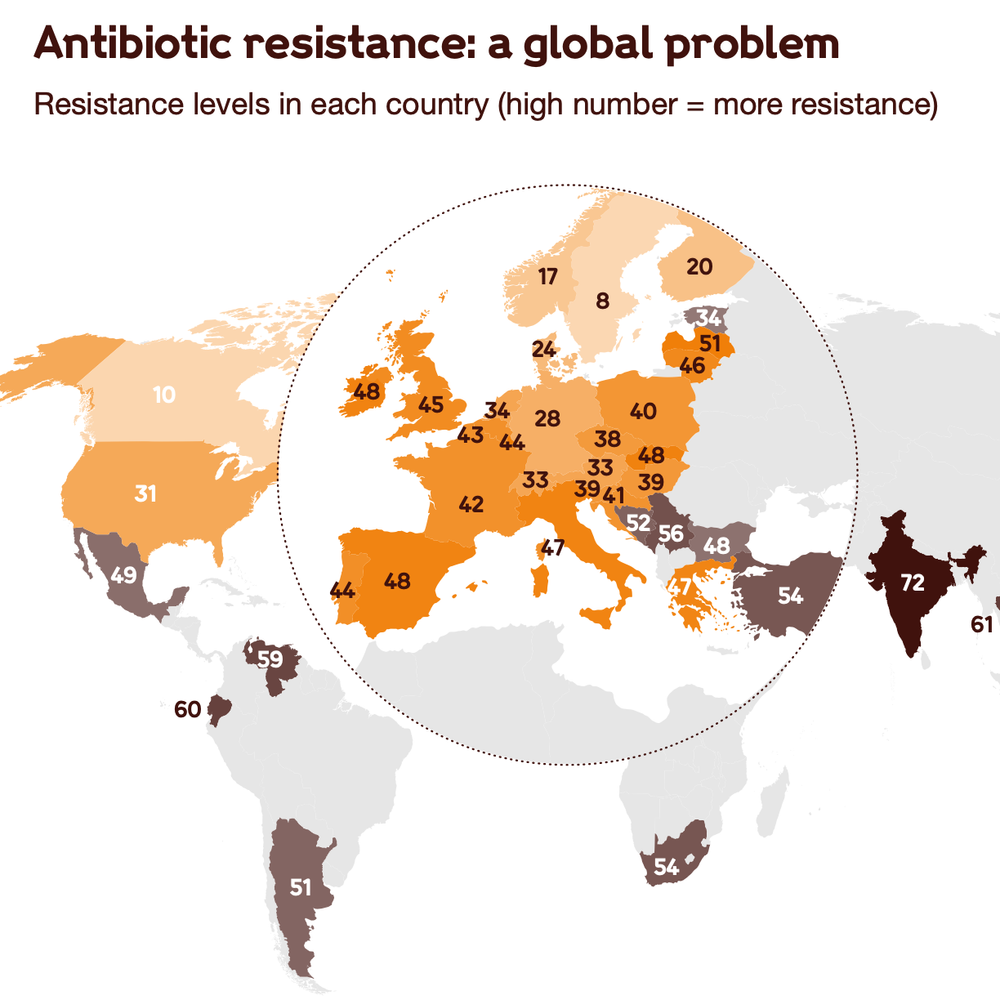
Antibiotic resistance
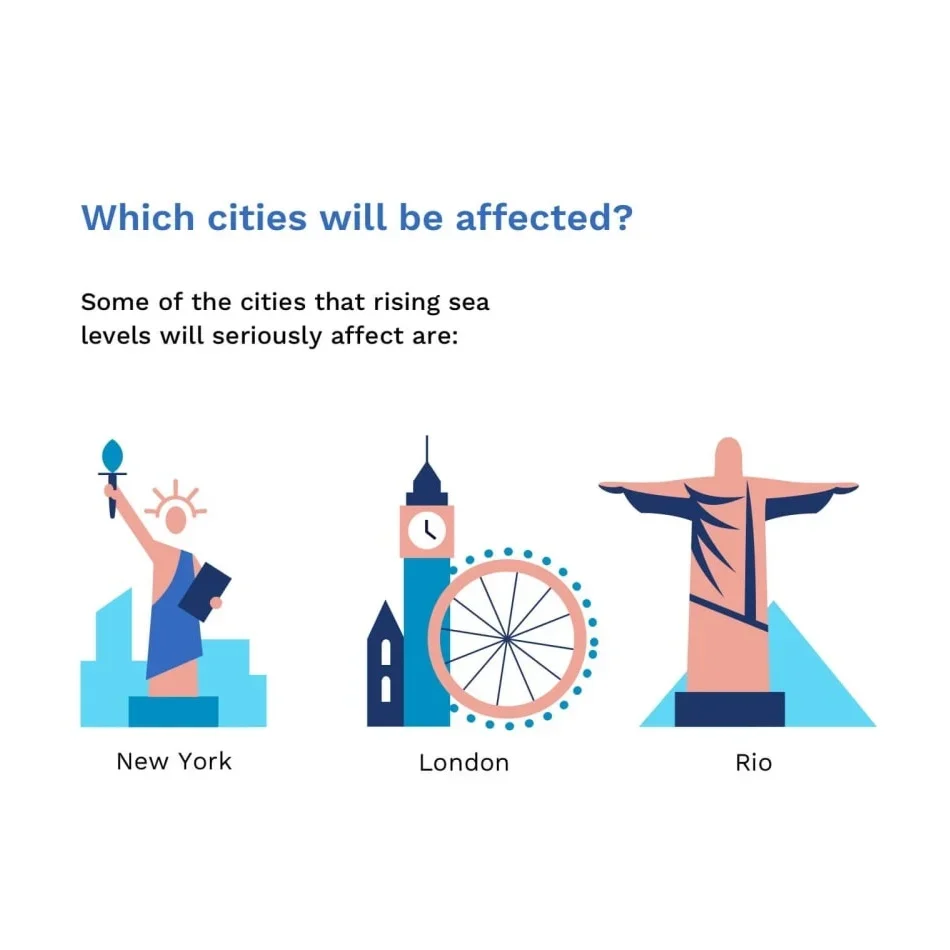
Cities & Climate Change
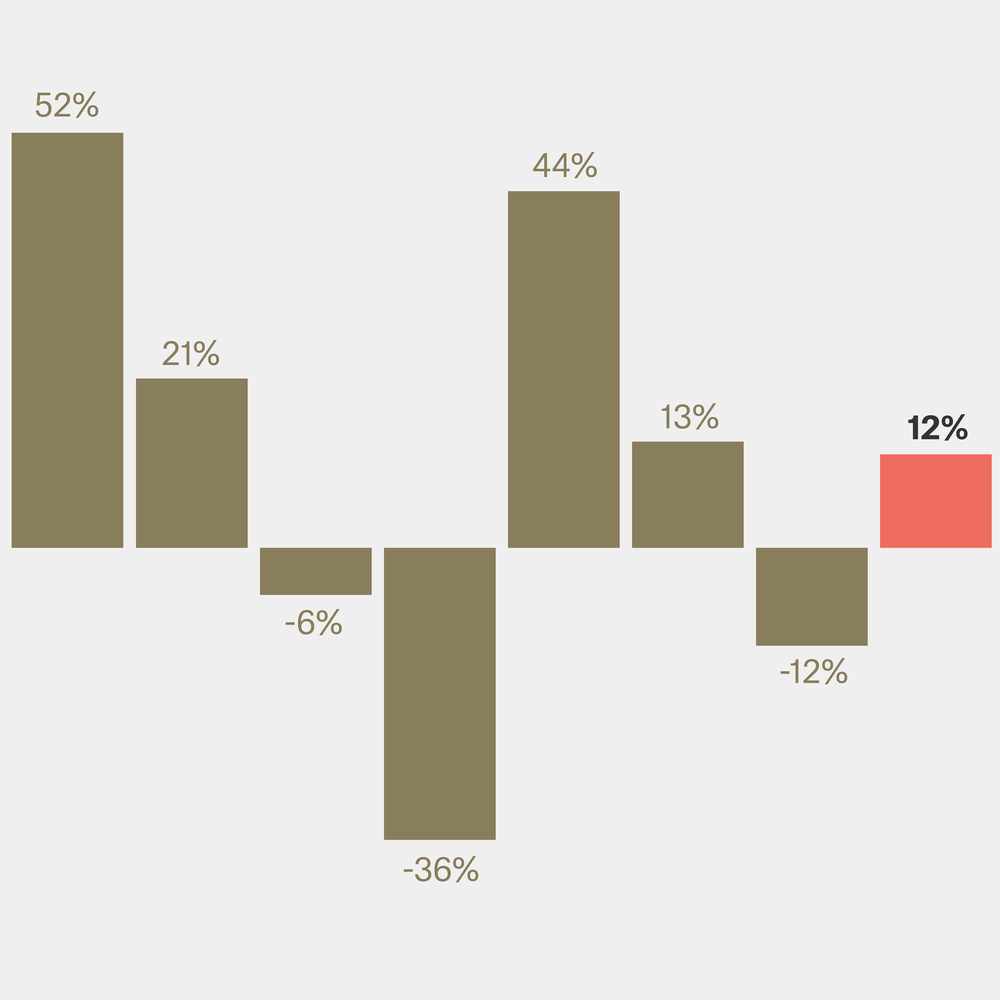
Art Market Economics

Adapting for Ageing
Genetic Technologies
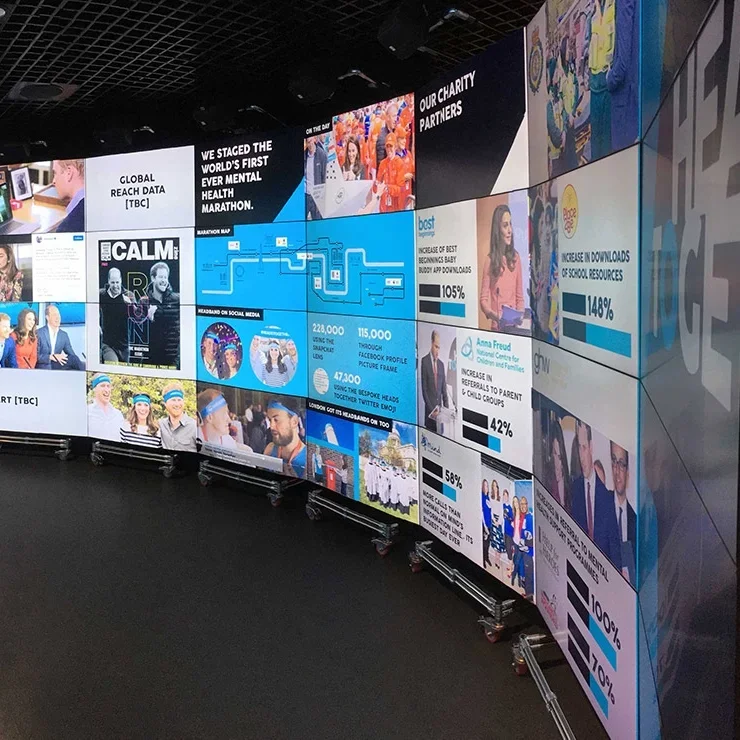
Heads Together
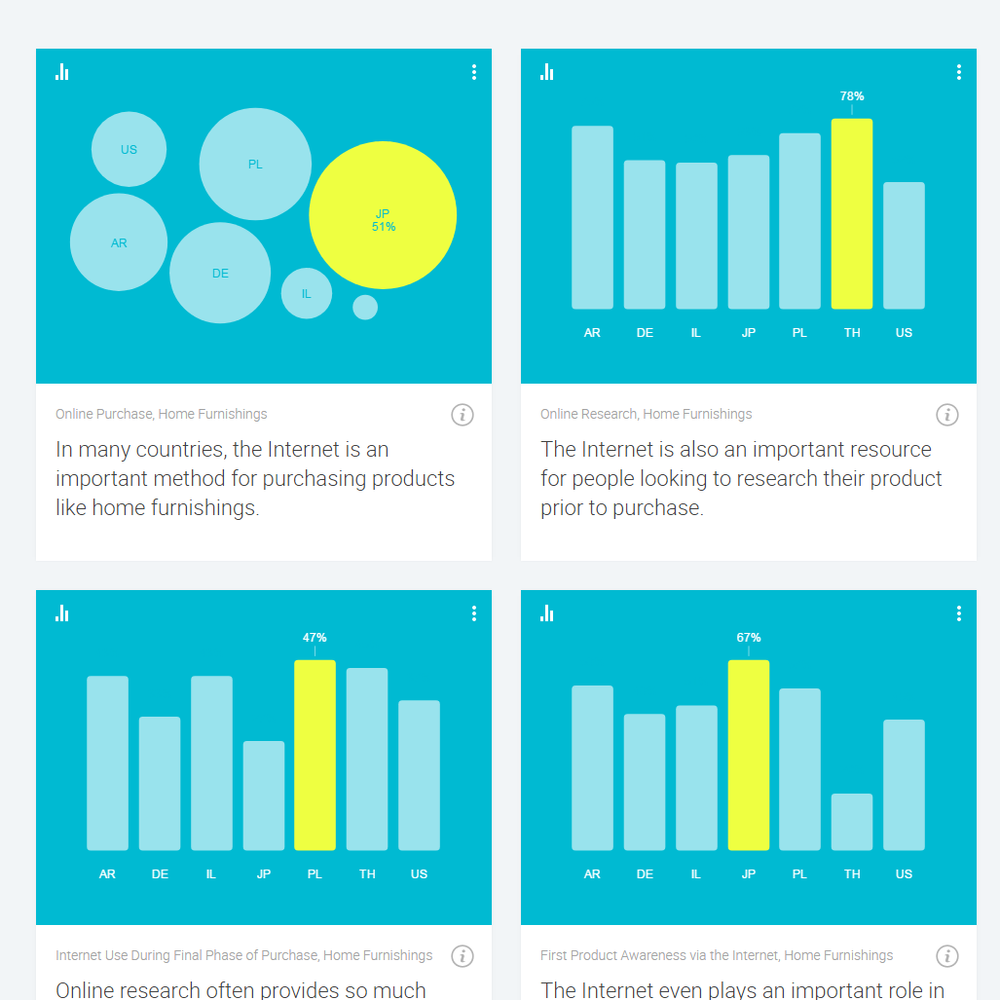
Consumer Barometer
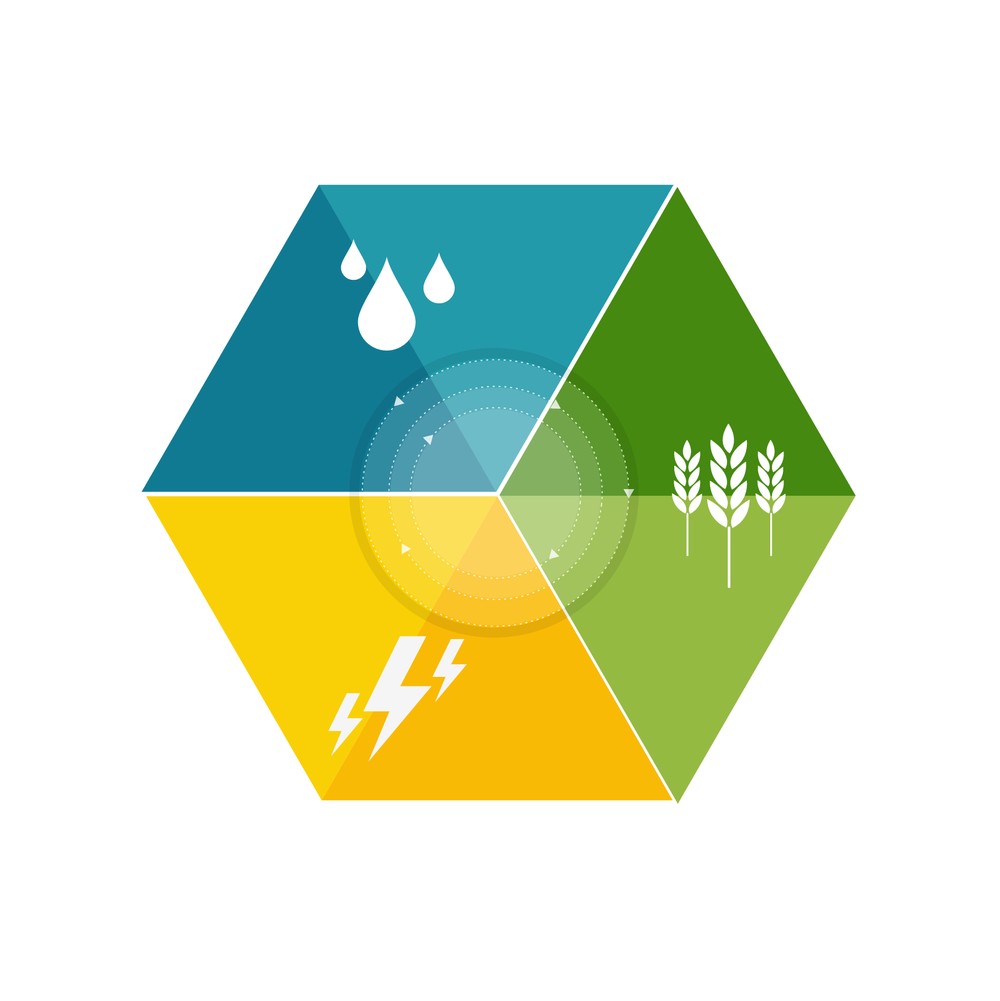
The Water, Food, Energy Nexus

Machine Learning Animation

INGO tracker
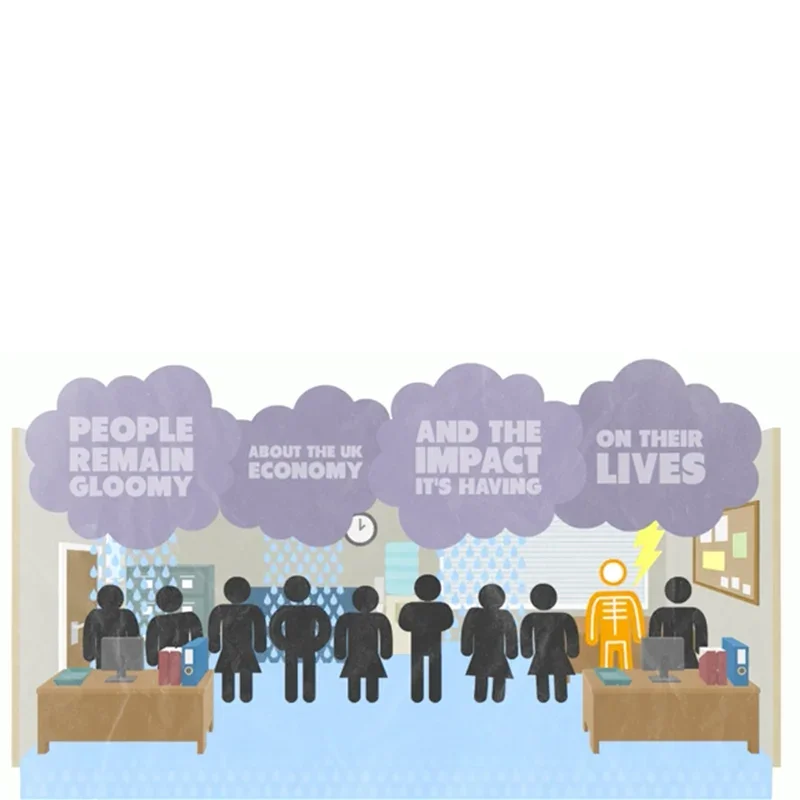
Public Opinion Monitor
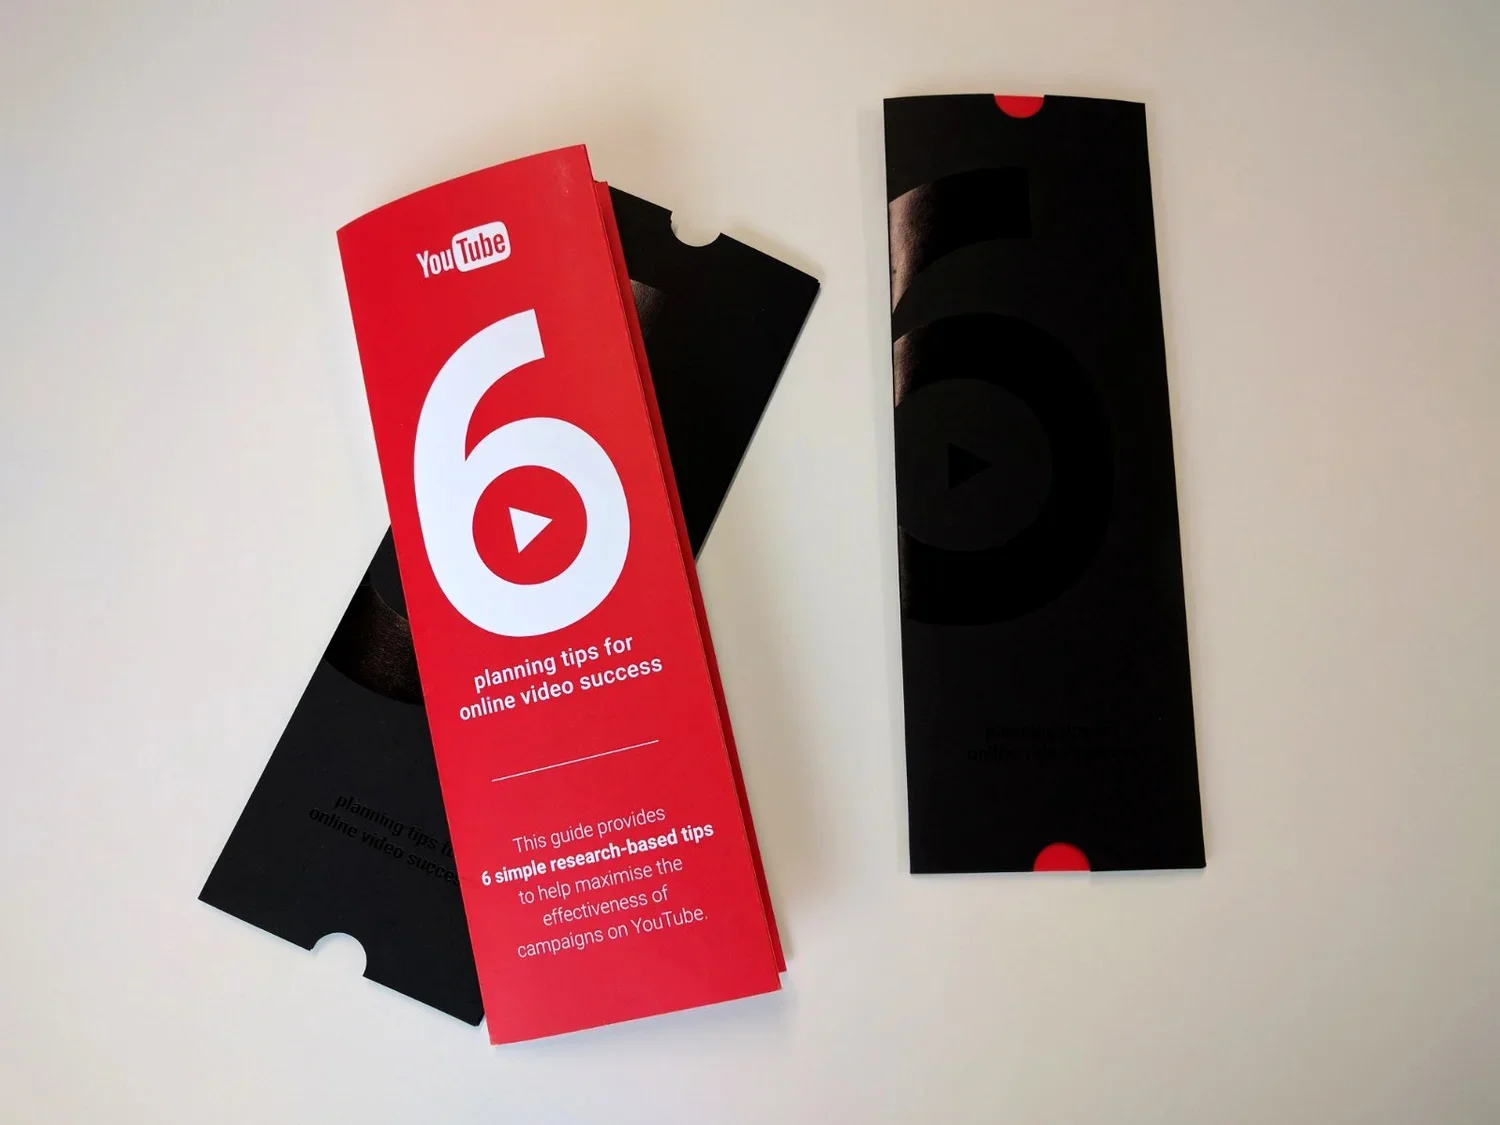
Online video success

UK election 2015
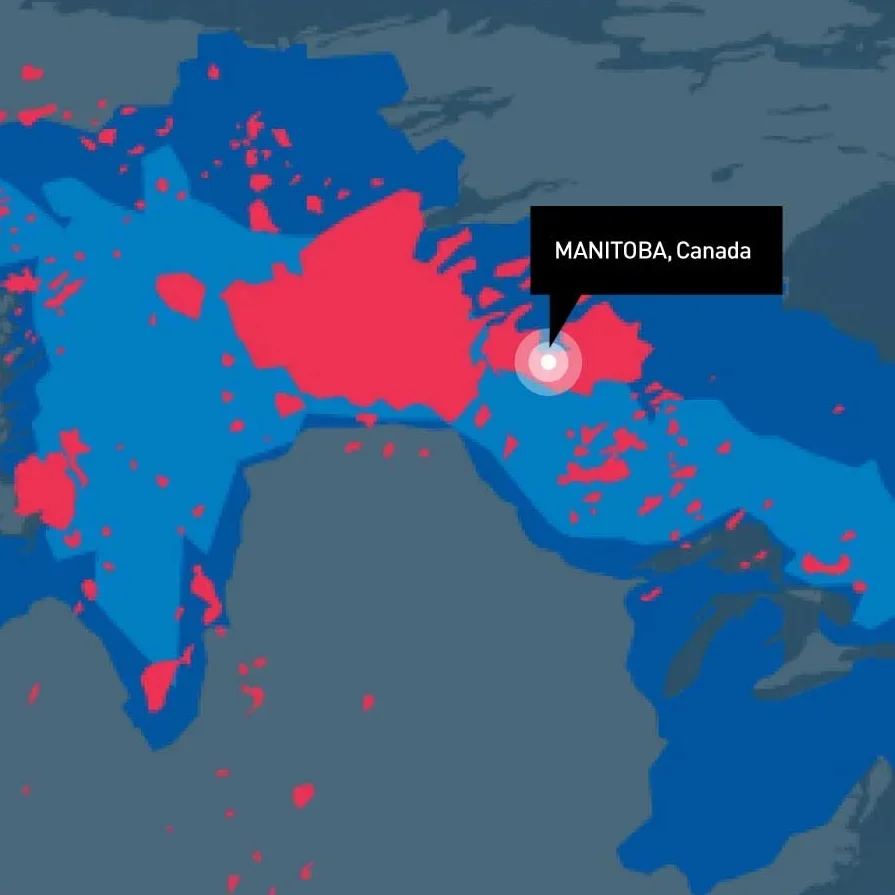
ESA satellite data
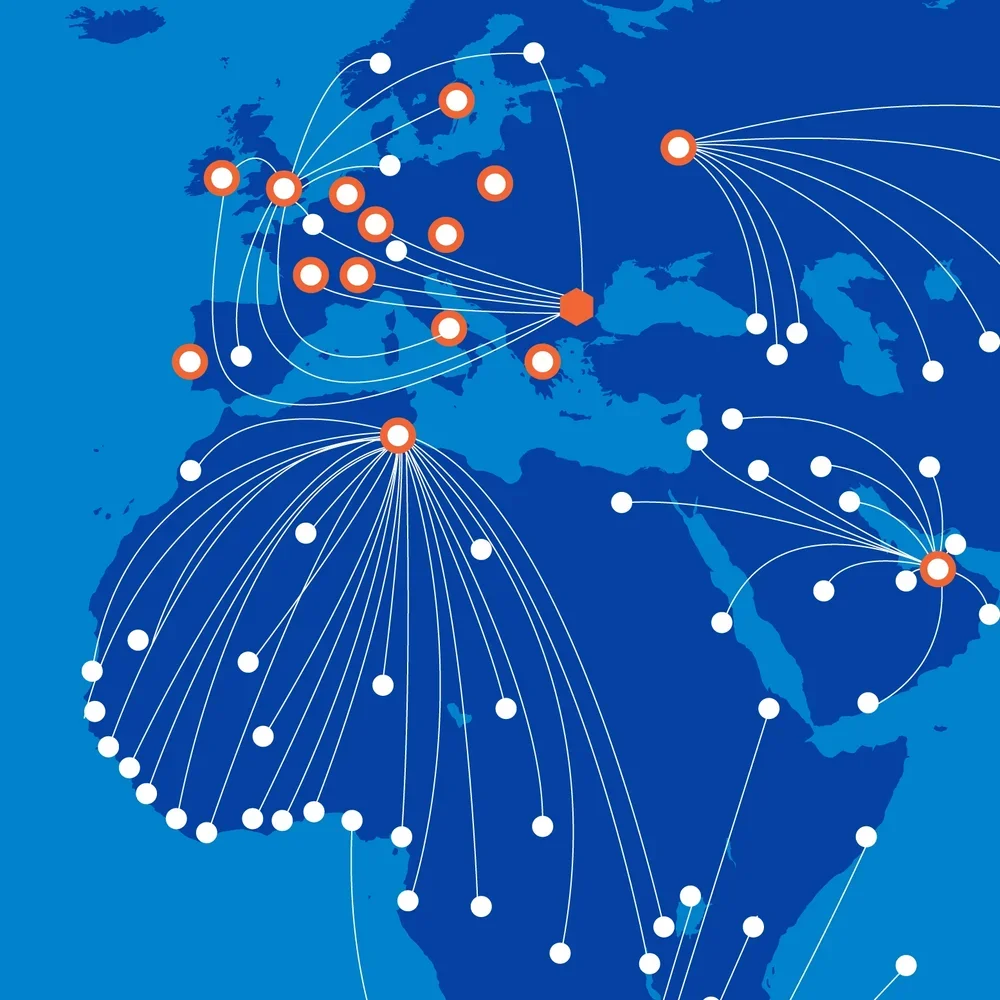
Pfizer report
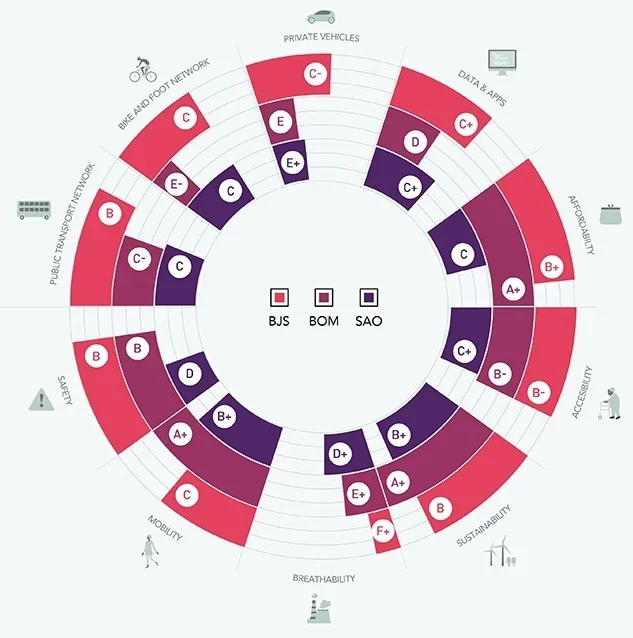
Vital Cities

Smarter Cities
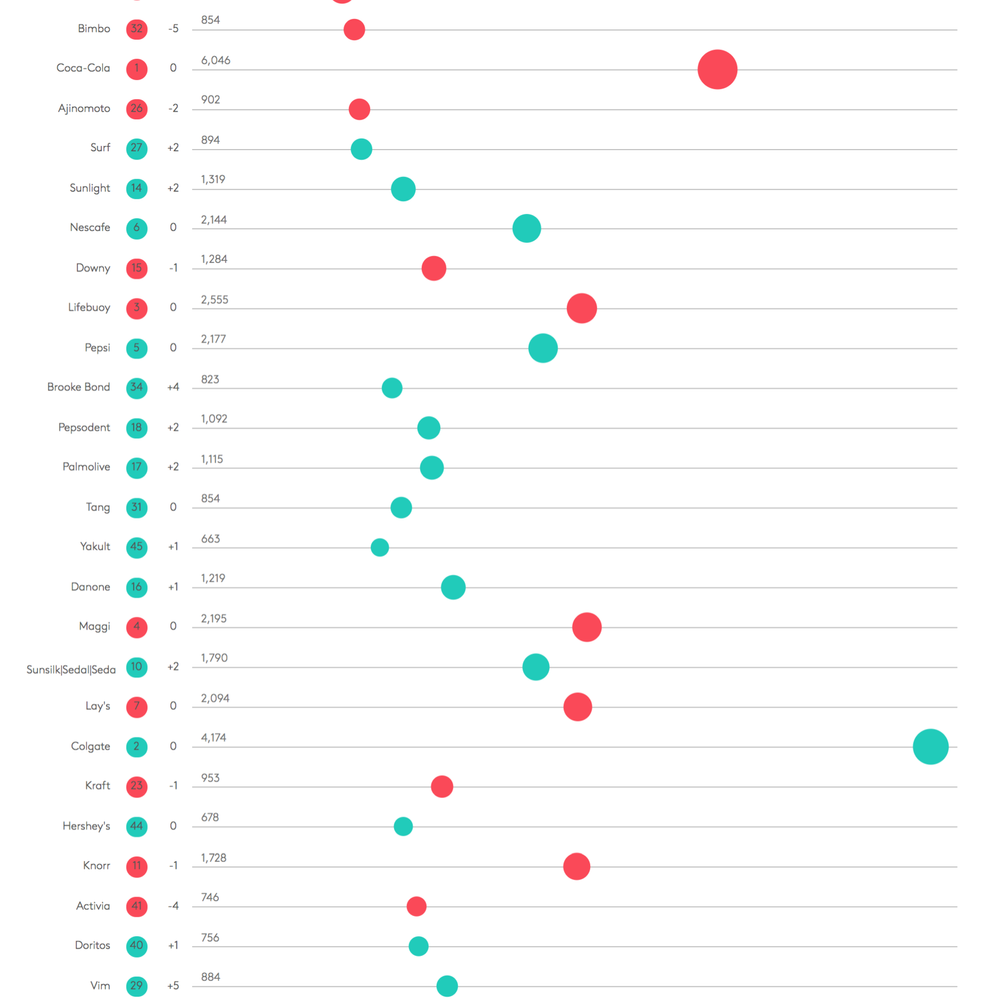
Brand Footprint

Sex workers and HIV
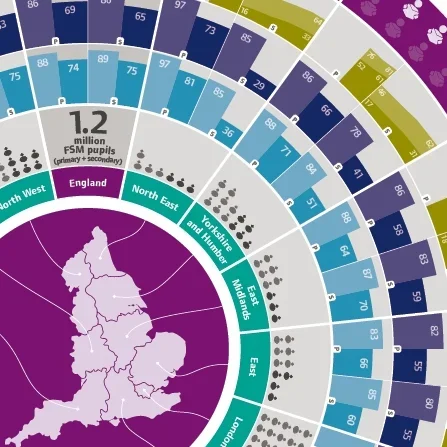
Access and Achievement

50 years of Shelter

British Social Attitudes
How we workOur speciality is data storytelling, but the data itself is yours. So our approach is always collaborative, looking to understand your data, brief and audience so that we can respond to all three.
Data visualisation is a form of visual storytelling, so we need to know the story before we can tell it. We work iteratively, first on the content, with sketches and wireframes, then on the visuals, working closely with you so that together we find the best way to tell your story.
ClientsWe work with a huge range of clients in all kinds of sectors from government departments and NGOs to communication business and corporations. Doing all kinds of things: print reports, infographics, interactive articles, online dashboards, animation. Even PowerPoint.





























TrainingWe run bespoke in-house data visualisation training on a wide range of applications, including social media graphics, animation and presenting data in PowerPoint presentations.
You can see our full offer on our sister site: www.addtwodigital.com
Get in Touch
If you want to talk about a possible project, training or just to have a chat about charts, drop us an email on info@addtwostudio.com or use this form.